Education / Interactive mathematics
Calculus Visualizer.
Making Calculus I concepts visible and interactive.
Explore limits, derivatives, and integrals through interactive graphs and AI-powered explanations.
The build
Learn by exploring the graphs
Our team of six developers built an educational web application to help students understand Calculus I through interactive mathematical graphs and visual explanations.
Students can explore limits, derivatives, and integrals, including interactive limits visualizations and customizable integration graphs. Google Gemini provides step-by-step explanations of mathematical concepts, functions, and graphs to support that exploration.
My contribution
My primary focus was developing Python scripts with NumPy and Plotly to generate interactive limit graphs and integrate them into the frontend.
- Developed the Python scripts behind the interactive limit visualizations.
- Integrated the graphs into the frontend and contributed to frontend development and graph functionality.
- Collaborated with five other developers using GitHub and helped deploy the application.
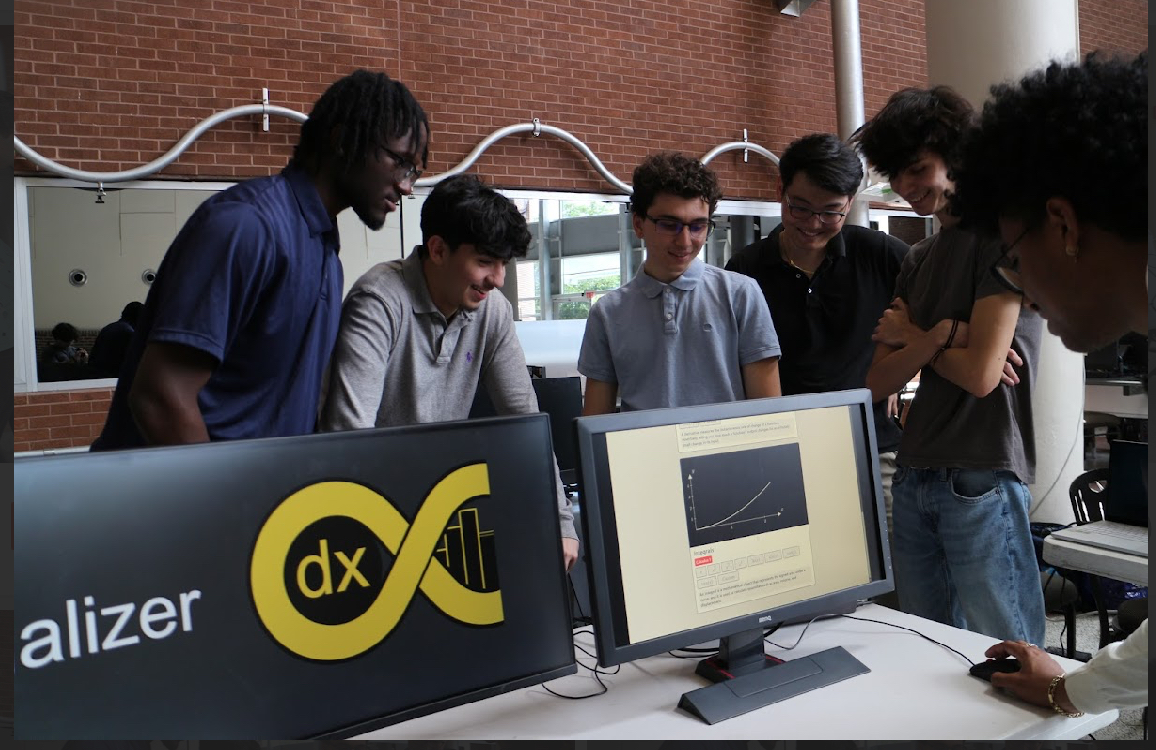
Sharing it at Knight Hacks Expo
I presented the application at the Knight Hacks Expo, where attendees could try it and explore the interactive mathematics functionality firsthand.